
In this post, we’ll look at another Open Source tool that you can add to your arsenal of testing frameworks and tools. This one’s called Coverlet and it examines your source code and reports on the areas that are being covered by one or more tests and perhaps more importantly, highlights areas that are not being covered by a test in your testing suite.
If you’re new here, this post is one in a series of posts that I’ve been writing recently about Automated Testing. Here are links to all the previous articles in this series:
- Part 1: An Introduction to Automated Testing
- Part 2: Frameworks & Tools for Automated Testing in the .NET Ecosystem
- Part 3: Your First Unit Test in xUnit
- Part 4: Further Explorations in xUnit
- Part 5: Unit Testing – What Should I Test?
- Part 6: Write Readable Tests with Fluent Assertions
Caveat Emptor
In part, I’m reticent in introducing the topic of Code Coverage as it is an area of contention. The issue is that the introduction of a code coverage tool leads to people in the organization, not just developers and especially non-developers (ahem, managers) deriving meaning out of the coverage results that are just plainly inaccurate. If there is a certain piece of code that’s not covered, it doesn’t automatically mean that there is something wrong or that it needs to get covered.
Then there are artificial goals and guidelines that get put in – the team must have x percentage of code coverage! Such policies often lead to adverse, unintended consequences. When building and maintaining a robust testing suite should be an exercise to increase code maintainability and as a result, team happiness, putting official measures in place to dictate that leads to developers writing meaningless tests just to bring up that code coverage percentage number. And no matter how one tries for that code coverage number to not mean much, a developer soon starts comparing their numbers against their teammate’s numbers. It could lead to undue stress or exacerbate imposter syndrome that developers often battle.
So, I’d encourage you, dear reader, to be aware of these potential negative impacts of introducing a code coverage tool even as you study its benefits.
Coverlet
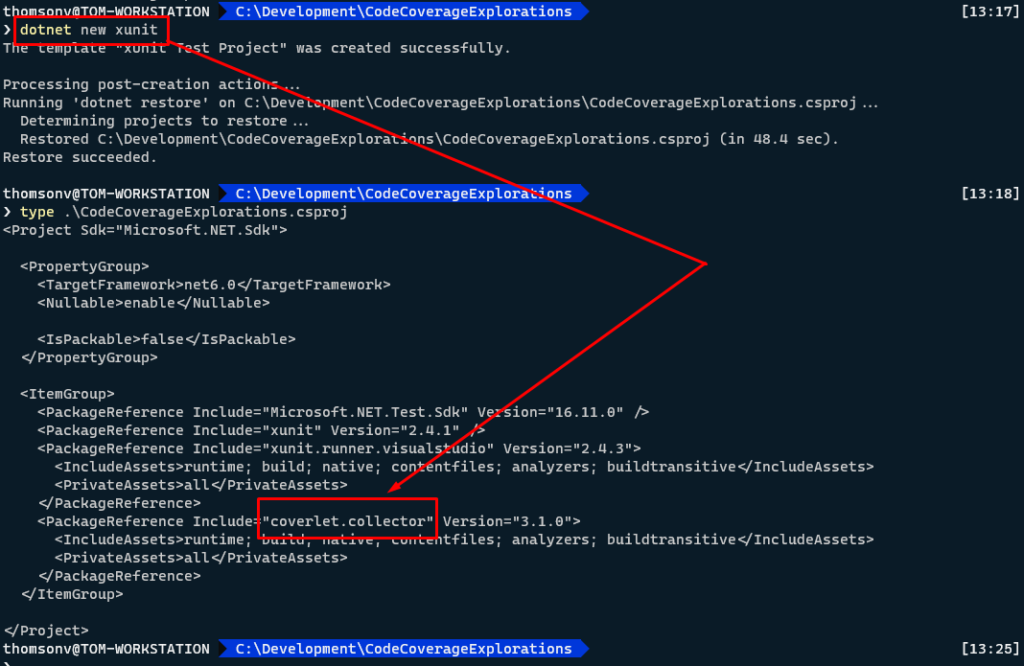
Coverlet is maintained out on GitHub, here: coverlet-coverage/coverlet: Cross platform code coverage for .NET (github.com). It’s also the default code coverage tool for dotnet xUnit test projects. If you create one of these from the command line, you’ll see that the Coverlet package is already included in the project.
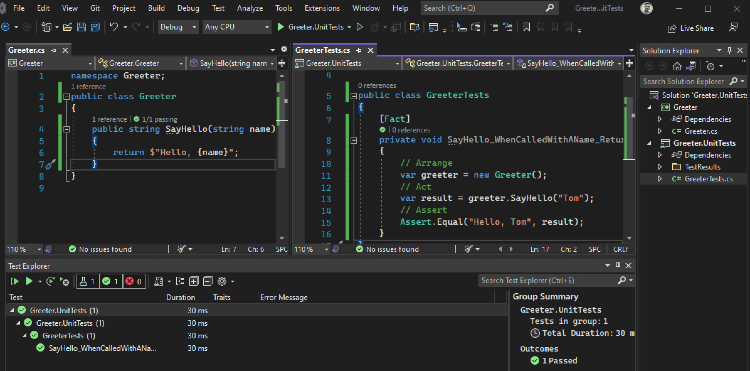
I’m going to attach a Class Library project to this with our simple Greeter class and add the associated unit test to this new xUnit project so that we can try out Coverlet.
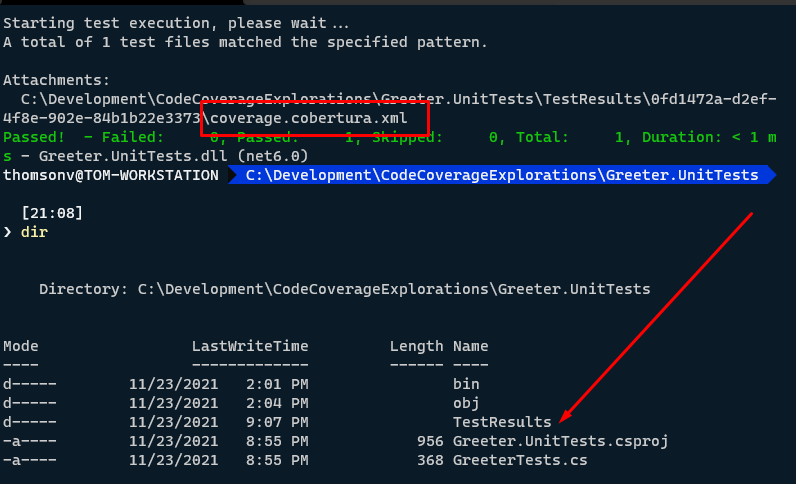
Next, open a terminal window to the unit test project location and run the following command:
dotnet test --collect:"XPlat Code Coverage"You should see output similar to below, indicating that a “coverage.cobertura.xml” file has been generated.
If you open up this XML file, you can probably make some sense out of it but it is really not meant for human consumption. It is a specific reporting format that can be ingested by a reporting tool or plugin that understands and supports it. In addition to this format, Coverlet also supports a handful of other common code coverage tool formats and you can change the output by providing different switches that are specified in their documentation.
Let’s install a report tool that will take the cobertura file that was generated and give us a better, human-readable report. In a terminal window, run the following .NET cli command to install this reporting tool. The -g option signifies that it will be installed globally, allowing you to invoke it from any directory.
dotnet tool install -g dotnet-reportgenerator-globaltoolNow with this tool installed, you can invoke the following command to have the reporting tool generate an HTML report out of a cobertura.xml file.
reportgenerator
-reports:"Path\To\TestProject\TestResults\{guid}\coverage.cobertura.xml"
-targetdir:"coveragereport"
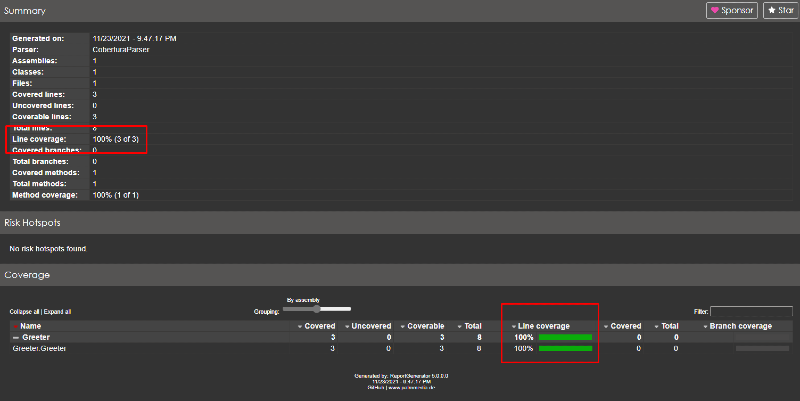
-reporttypes:HtmlAfter executing the command, open the HTML file that was generated. It should give you a friendly report showing you the code coverage metrics for your codebase.
Closing Remarks
While it was easy for me to show 100% coverage of my simple one method class with a single line of code, it is not representative of real-world codebases. However, use the steps that I outline above to get reporting of your own codebases. Let it inform you and use it to find any hotspots in your codebase that could perhaps use some test cases. Remember: don’t get dogmatic about these.
Another aspect of this that I didn’t get to cover in this particular post is to demonstrate how one can take a tool like Coverlet and plug it into a CI/CD pipeline. Then you can have your tests run automatically on every build and also have Coverlet or a similar tool calculate code coverage and display the numbers on a dashboard in Azure DevOps or wherever you have your CI/CD pipelines established. Perhaps, we’ll cover this scenario in a future episode.