
For the last couple of weeks, we’ve been looking at SQL Server Management Studio (SSMS), the de facto tool for all things SQL Server. If you have missed those, you can check them out here:
- SQL Server Management Studio – Tips and Tricks
- SQL Server Database Engine Tuning Advisor – An Introduction
Today, let’s take a cursory look at the Execution Plan viewers in Visual Studio. These allow you to take a peek under the covers and see what the SQL Server engine is doing to furnish the results of your query. Some queries come back with results in a fraction of second while others take several minutes to complete. Looking at the query’s execution plan will give you insights into where the bottlenecks may be in your query. Not only is this tool an indispensable tool in query optimizations, it educates you on how SQL Server does its underlying operations and that knowledge will ultimately lead you to write performant queries and conduct other database operations (indexing, statistics, indexed views, etc.) for your application needs.
What’s an Execution Plan, anyway?
Before we look at the tools, let’s define what an Execution Plan is in the first place. It is the course of actions that SQL Server is planning to take to retrieve your results. Much like how your navigation system gives you a route plan that gives you an overview of all the major routes that it will direct you through, to get you from Point A to Point B, the execution plan outlines the steps that SQL Server will take, to filter down the tables, rows and columns to give you exactly what you asked for.
Viewing the Execution Plan
In SSMS, from within a Query Editor window, you can choose one or more tools in relation to viewing the execution plan for a query. These tools are available both as buttons in the toolbar and are also available in the right-click context menu in the query editor.
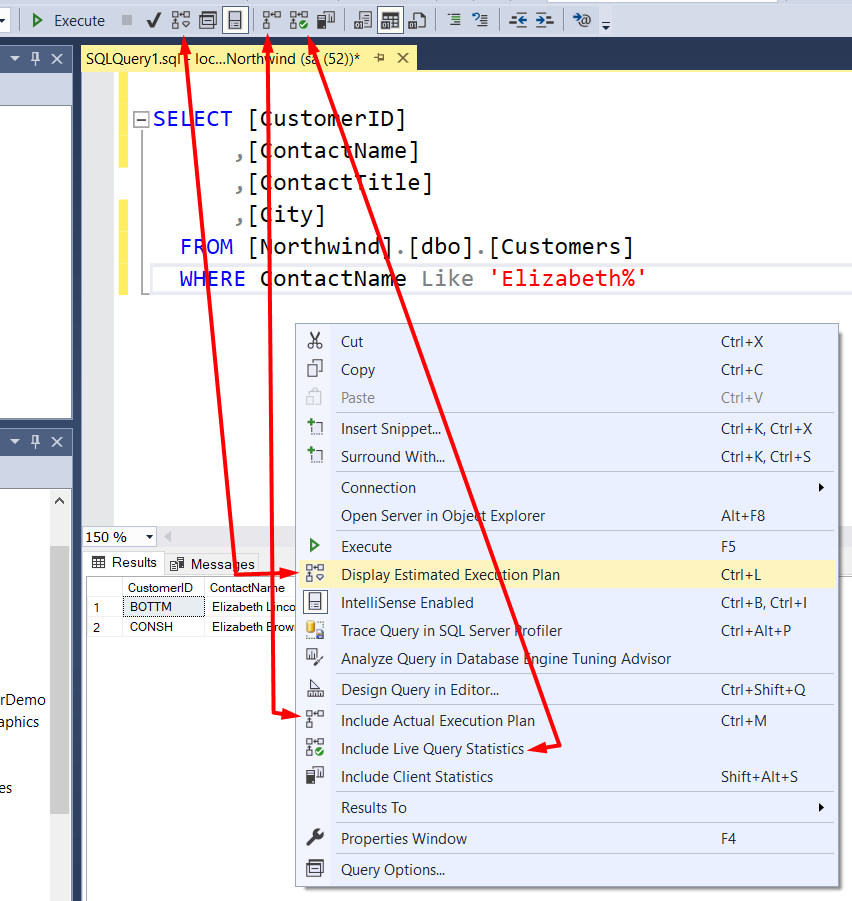
- Display Estimated Execution Plan: This option allows you to view the plan without having to execute the query.
- Include Actual Execution Plan: While the estimated plan will be determined via indexes and statistics ahead of the actual query being run, the actual plan will include additional and specific details on what actually took place in retrieving the actual result-set.
- Include Live Query Statistics: You may have a really crazy query at hand that may be running for several minutes or even hours without actually returning anything. Turning on the Live Query Statistics option will give you a neat, animated visualization of the work that SQL Server’s engaged in, displayed in real-time, as the query is executing. This will give you a quick glimpse at the bottleneck (there may be several others) that’s holding things up.
Reading an Execution Plan
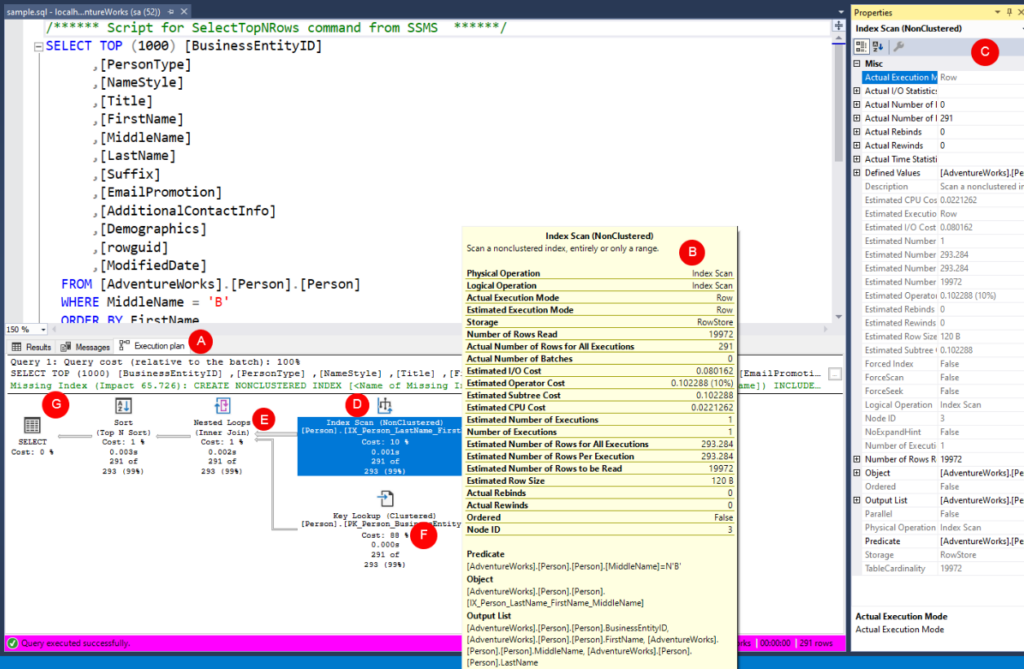
Take a look at the example execution plan that I’ve shown above.
- In SSMS, when you opt to view an Estimated Execution Plan or an Actual Execution Plan, you can see them in the new tab that appears below the query A.
- Each block that you see in the diagram is called an operator.
- Hovering over an operator will give you some details in a popup tooltip B. You can also click on an operator to select it and then press F4 to bring up the properties window that will provide you the same information in a persistent format C. They provide valuable information on what’s happening behind the scenes. For example, it displays the Number of Rows Read in order to find the ones that you were looking for in your query.
- You read an execution plan from right to left, top to bottom. So, for my example plan above, you start at the “Index Scan” operator D and make your way towards the left. Whenever you see a junction E, you start at the end of that branch and work your way back up to the junction and then towards the left most item in the plan.
- The thickness of the arrows show the filtration process – a thick line means that there is a larger volume of records that resulted out of that operation.
- Take a note of the Cost percentages F displayed at each operator. The higher the cost is, the more time and resources it took to carry out that operation.
- In some instances, SQL Server will give you various hints to alert you of potential issues in your database modeling. Sometimes, it will display a double exclamation mark to grab your attention to a potentially taxing operation (not displayed in this example). Sometimes, it will suggest the creation of an index G that could make the query more performant.
Closing Remarks
There is a wealth of information that SQL Server provides in the form of an execution plan that aids you in troubleshooting problematic queries. It is often the go to resource when it comes to performance tuning. In this post, we have simply been introduced to the main players. In a future installment, we’ll dig a little deeper and look at the types of operators and how they affect the performance of your query, either in a negative or a positive way. Stay tuned.