
Azure, Microsoft’s cloud platform, provides a robust set of services and tools for deploying, managing and monitoring applications. One key aspect of maintaining a healthy infrastructure is to have a proper monitoring and alerting system in place. But this space can seem quite vast and overwhelming. Where do you get started? Today, let’s look at how we can setup a simple alert to notify you via email, whenever a user encounters an unhandled error within your Azure App Service web application.
What is Azure Monitor?
Azure Monitor collects, analyzes, and acts on telemetry data from your Azure resources. It offers full-stack monitoring, advanced analytics, and intelligent insights to ensure the availability and performance of your applications. It can be tied to a host of on-prem and Azure cloud resources — anything from networking events, databases, containers, operating system metrics, VMs and custom applications. It can collect different types of data points — metrics, logs, distributed traces and changes, that are then ingested by the Azure Monitor system for providing all sorts of analytics and integration capabilities.
Setup Your First Alert
For this example, I’ve setup a simple ASP.NET application that I’ve deployed to an App Service instance in Azure. It’s a web API that has a single endpoint that produces a result at random whenever you invoke it. You may get:
- a successful response – a
200 OKresponse in HTTP speak, from the web server. - a
400 Bad Request– an HTTP response code that is typically used to indicate that the user did something wrong when invoking the API. - a
500 Server Error– an HTTP response code that is typically used to indicate that there was a problem at the server in processing the incoming request. This is the code that we’ll target in our example today, to setup an alert on. - a
404 Not Found– an HTTP response code that is used to denote that the resource requested by the user was not found.
If you’re interested in creating a dummy, test endpoint to do the same, here’s the C# code snippet for that endpoint, below.
Example Application
[HttpGet]
[Route("Surprise")]
public IActionResult Surprise()
{
    var randomNumber = new Random().Next(1, 4);
    switch (randomNumber)
    {
        case 1:
            return new OkObjectResult("I'm a good response");
        case 2:
            throw new Exception("I'm a 500 error");
        case 3:
            return new BadRequestObjectResult("I'm a bad request.");
        default:
            return new NotFoundObjectResult("What you asked for was not found.");
    }
}
Deploy your application to Azure App Service. You can right-click deploy from Visual Studio or use extensions in VSCode or there are a myriad other ways to do this but a bit beyond the scope of this particular post.
Setup Application Insights
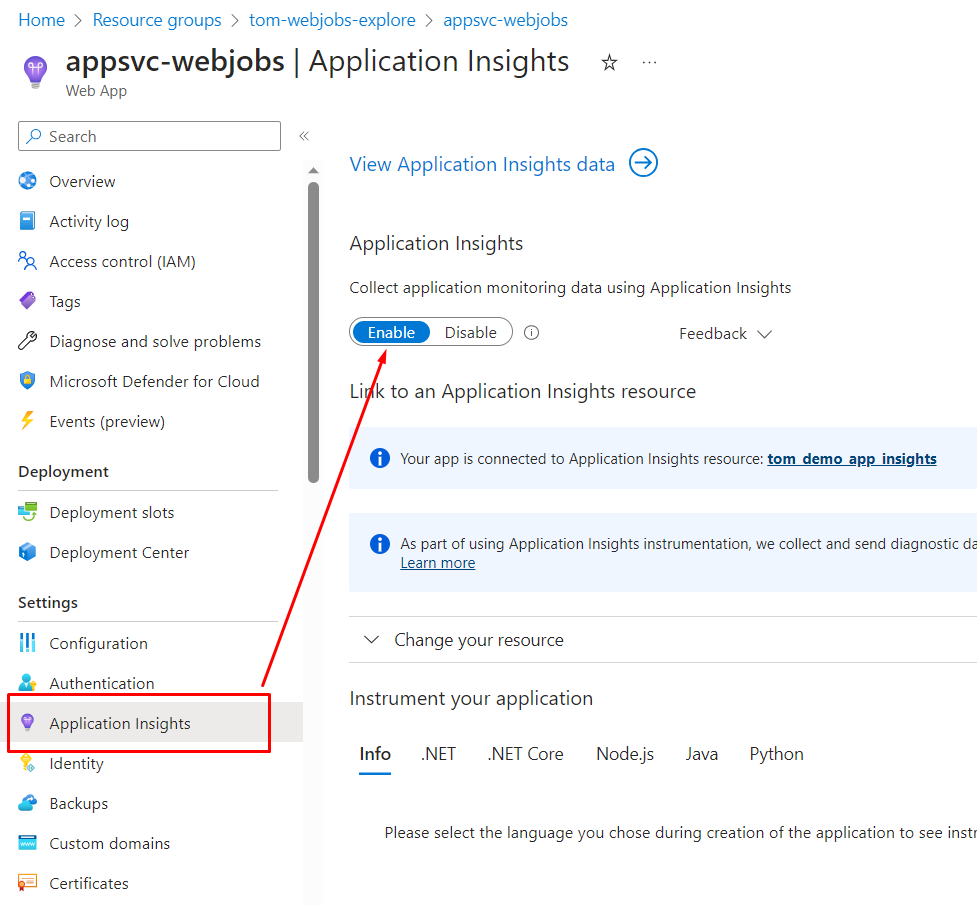
Application Insights is the tool that will monitor your web application and generate various metrics that you can then write alerts against. Its capabilities are vast and expansive but for purposes today, we’ll just utilize one of the many metrics it keeps track of — unhandled exceptions encountered within your application. While you can setup and configure Application Insights manually, Azure makes it a very simple process for us when it comes to applications hosted in App Service. It’s as simple as flicking on a switch.
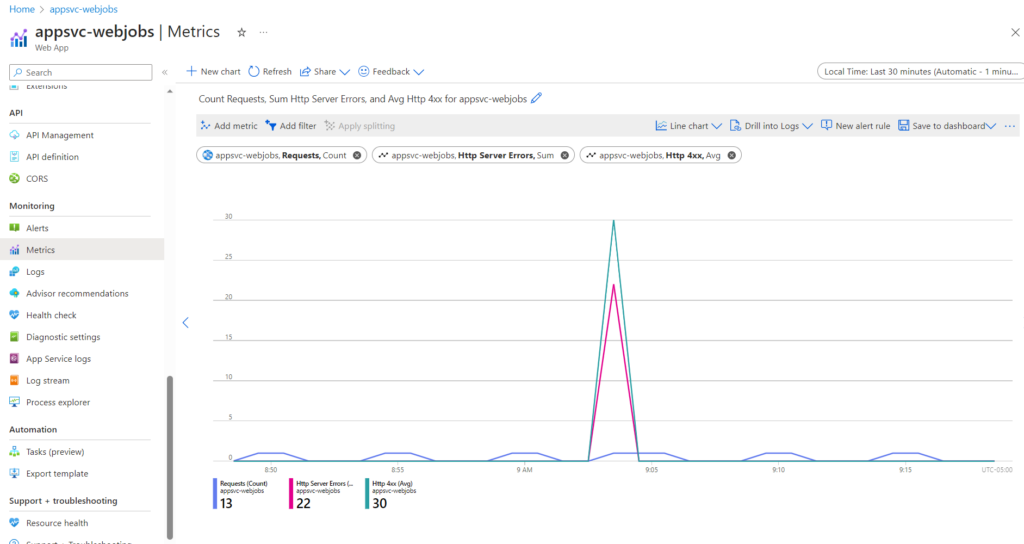
Generate Metrics
With Application Insights in place, the next step is to generate some metrics that we can monitor. In the case our test application, hit the test endpoint several times as it will generate errors at random on some of those invocations. Visit the metrics blade of your App Service to explore all the different tidbits of information that you can glean about the health and usage of your web application.
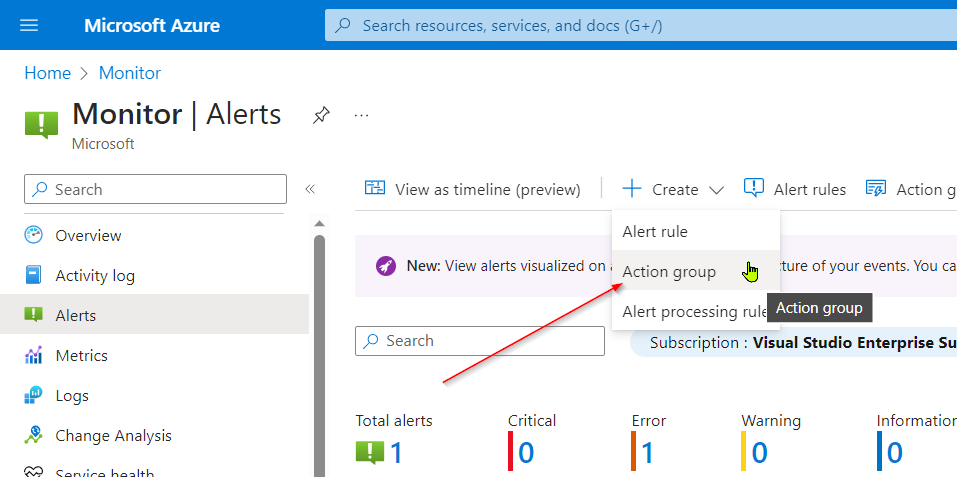
Create an Action Group
Now we have the metrics on which to generate alerts. But who should be alerted? For that let’s create what Azure calls an “Action Group”. In the Azure Portal, search for and select Alerts. Click the Create button and you’ll get a context-menu item for Action Group. Select this option.
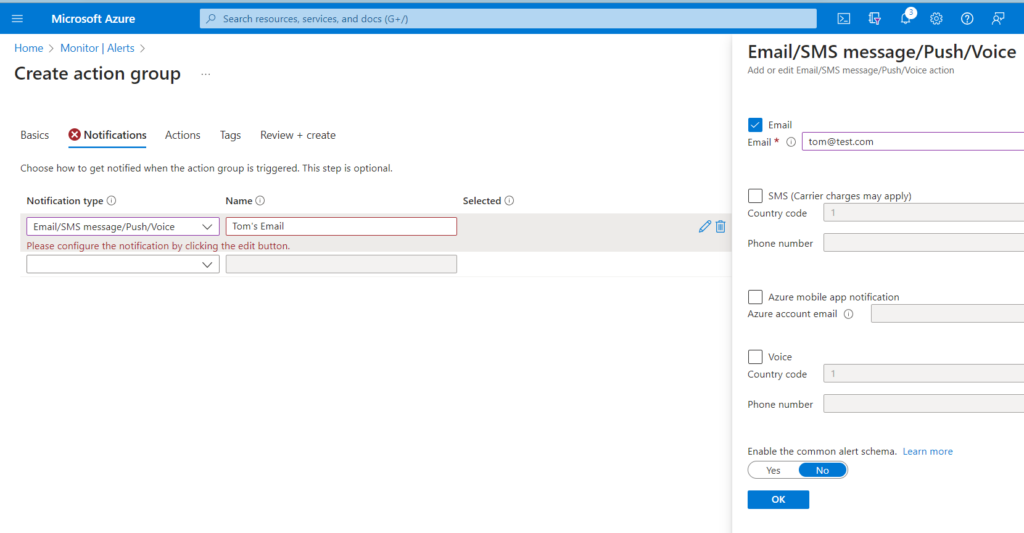
Provide a name for your action group, and navigate to the notifications section. I’m selecting the “Email/SMS message/Push/Voice” option and simply specifying my email address. You can also opt to receive a text message, a push notification on your mobile device or get a voice call alert.
Create an Alert
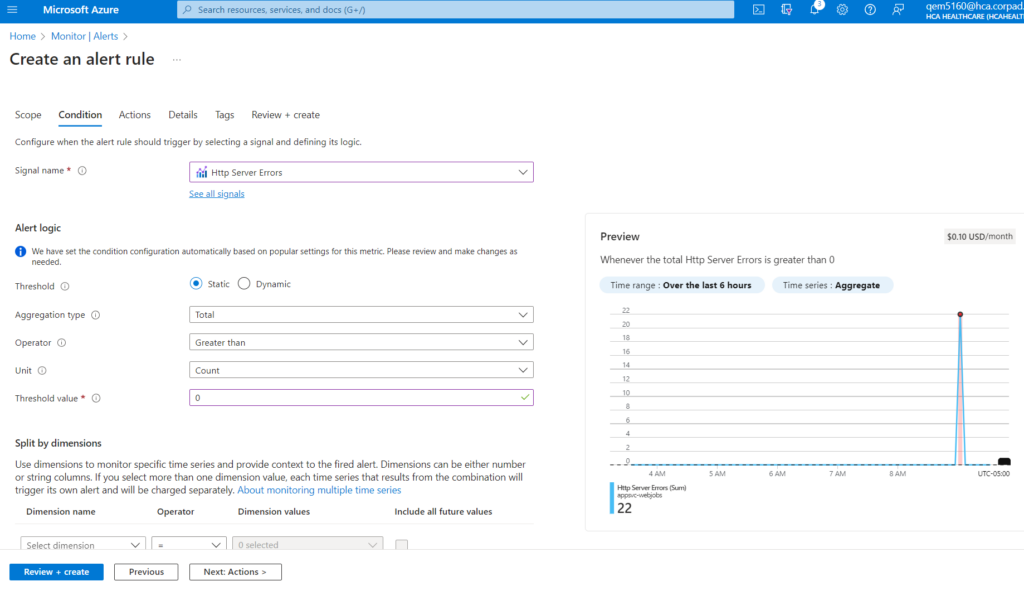
As you did in the previous step, from the Alerts section, click the Create button but this time, select the “Alert rule” option. You can create alerts on all sorts of resources. You can use the filters provided to narrow down to your App Service instance. Once you’ve located and selected it, move on to the “Conditions” tab. Here you’ll setup the conditions that will trigger your alert. For this example, I’ve selected “Http Server Errors” and specified my thresholds. Before you setup your thresholds, take a look at the “When to evaluate” section. The defaults are set to check your resource metrics once every minute and upon each check, look back at the past five minutes of activity. Those are adequate for this example. With that in mind, look at and adjust your threshold as needed. I’m specifying that I should be alerted when any errors are detected within my application (total greater than zero).
Next move on to the “Actions” tab. Here, you’ll tell Azure what action(s) to take when a particular alert is triggered. Remember that Action Group we created in the previous step? Let’s select that action group, here.
Test
Hit your test endpoint and generate some more errors. Check your inbox and if all goes well, you should start receiving error alert emails from Azure, notifying you of problems in your web app that you should investigate and resolve.
Closing Thoughts
Azure Monitor is a powerful utility that provide comprehensive monitoring and alerting capabilities for your cloud resources. Properly setup, it not only keeps you informed about the health and performance of your resources but can proactively alert you to potential issues before they become critical. Take the time to setup and fine-tune your monitoring and alerting strategy to ensure your Azure infrastructure remains robust and resilient.