
The past couple of weeks, we’ve been looking at monitoring and alerting options in Azure. If you haven’t checked out those posts, you can view them here:
- Stay Alert with Azure: Unlocking the Power of Azure Monitor and Notifications
- Azure Monitoring and Alerts Part 2: Application Insights Availability Tests
While alerts allow you to get notified about potential issues automatically, you may want to actively review the health of your azure resources, at a glance. You may want to study usage patterns, share metrics with your team or may simply want to interact with these metrics in a visual format. In this post, we will do just that by learning how to create a dashboard in the Microsoft Azure portal.
Why Use an Azure Dashboard?
Before we delve into the creation process, it’s worth understanding the value of an Azure dashboard:
- Centralized View: Dashboards consolidate various metrics and details from different Azure resources into one place.
- Customizable: Dashboards are highly customizable, allowing users to display only the most relevant information.
- Shareable: Once created, dashboards can be shared with other members of your team.
- Interactive: Users can drill down into metrics and navigate to resource blades directly from the dashboard.
Create Your First Dashboard in Azure
- Log in to Azure Portal: Navigate to https://portal.azure.com/ and sign in with your credentials.
- Open Dashboards: On the left-hand menu, click on “Dashboards.”
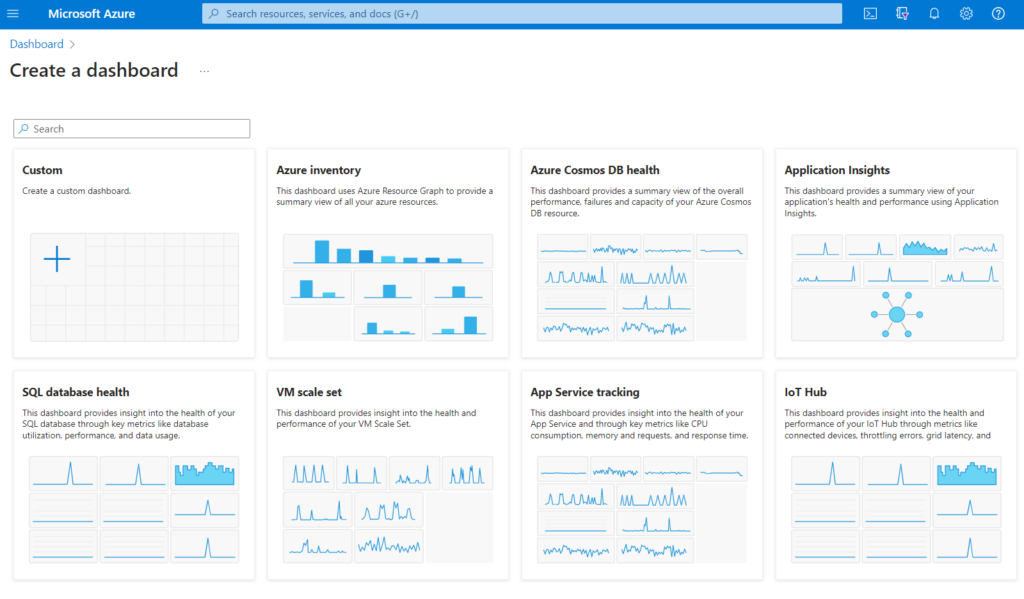
- Create a New Dashboard: Click on the “+ New dashboard” button. You can pick from a list of templates or create a custom dashboard from scratch. Provide a name and description for your dashboard.
- Add Tiles: Once you’re in the dashboard editing mode, you can start adding tiles. Click on the “Edit” button (it looks like a pencil) at the top of the page. From there, click on the “+ Add” option. This will allow you to choose and add tiles from a wide range of available services, including Virtual Machines, Storage Accounts, and more. Each tile represents a particular metric or information piece from that service.
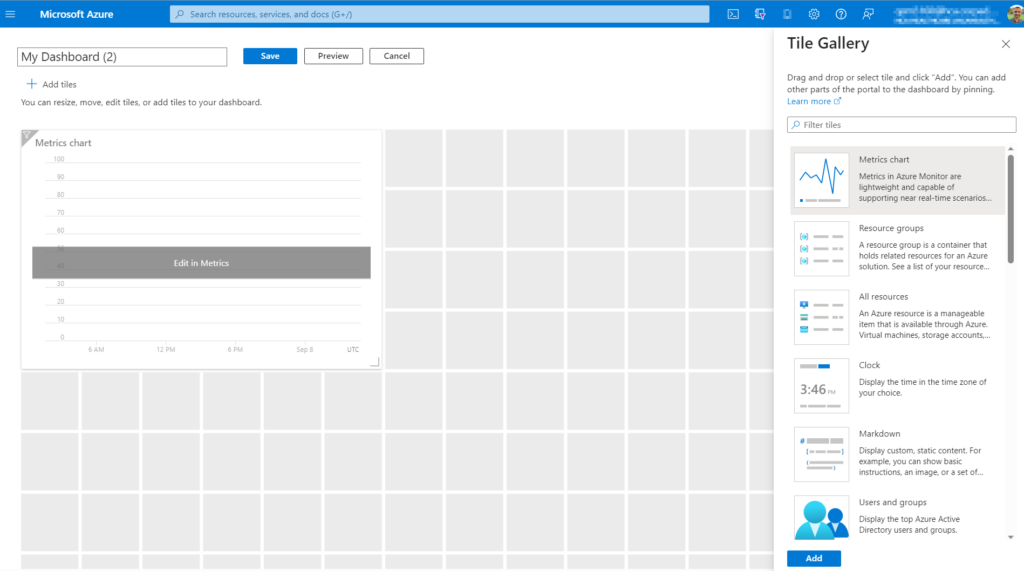
- Customize Tiles: After adding tiles, you can resize and move them around to arrange your dashboard as you see fit. Click on a tile to adjust its size, and drag it to rearrange its position.
- Add a Full Resource Blade: If you want to see detailed information about a particular resource, you can pin its entire blade to the dashboard. Navigate to the desired resource and from its blade, select the “Pin to dashboard” option.
- Save Your Dashboard: Once you are satisfied with the tiles and their arrangement, click on the “Done customizing” button at the top.
- Share the Dashboard: If you want to share the dashboard with other members of your team, click on the “Share” button at the top. This will allow you to publish the dashboard to the shared dashboard library, making it accessible to other users in your directory.
Closing Thoughts
Azure dashboards are a fantastic tool for streamlining resource management and monitoring. They provide a centralized, custom view that can be tailored to individual or team needs. Whether you’re overseeing a complex infrastructure or just need quick insights into specific resources, Azure dashboards can enhance your cloud management experience. Start building your custom dashboard today and leverage the full power of the Azure portal!